If you’re like me, you have shares spread over a number of brokers, accounts, pensions etc etc. It can make tracking your portfolio a nightmare. There are some websites which offer portfolio tracking for free but I have never found one which has all the functions I would like. That’s when I decided to build my own simple spreadsheet in Google Docs to monitor my portfolio for me. It has live prices fed into it, as well as exchange rates and now makes monitoring my portfolio a breeze. And now with the help of this guide below, you too can monitor your portfolio in a totally customized way with Google Spreadsheets.
You can follow this guide while looking at this spreadsheet I made as an example.
Step 1: Open a Google Drive account
Google Drive is a free online storage drive, but we are mainly using it for its ability to create and store a Google spreadsheet. I chose Google because it is the simplest (and cheapest!) spreadsheet software available, and I would guess most people already have a Google account so opening Drive isn’t a problem. It is possible to monitor a portfolio with Excel, but not everyone has access to it.
Step 2: Create the spreadsheet
Once you have a Google Drive account, you simply click on the ‘Create’ button and choose ‘Spreadsheet’. Done!
Step 3: Listing your portfolio and tickers
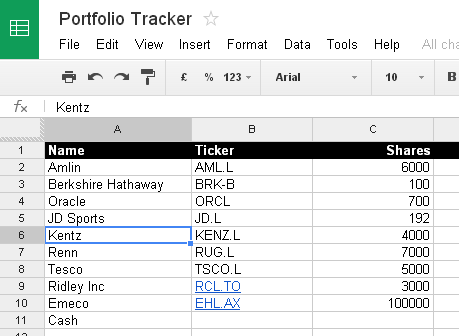
I recommend listing the stocks you own in the portfolio down one column, with their tickers in the column next to them. You can use either Yahoo or Google (more often than not they are the same) but I find Yahoo has a greater range of markets. Finding the Yahoo ticker is easy, simply search for it on the Yahoo Finance website. For example Kentz is listed on the London Stock Exchange, and its Yahoo page shows the ticker in brackets just after the name, “KENZ.L”. Go through a similar process if you prefer Google finance.
Once you have the tickers, add another column with the number of shares you own of each stock.
Step 4: Get share prices.
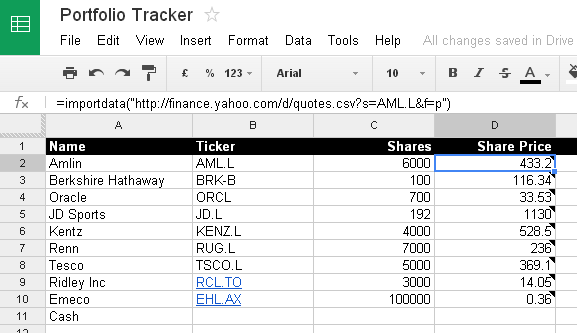
You have a choice of either using Google or Yahoo for share prices. I understand Yahoo uses prices from the previous day whereas Google is only a 15 minute delay, but Yahoo seems to have more international stocks. The following formula in Google spreadsheet will get the share price from Yahoo
=importdata(“http://finance.yahoo.com/d/quotes.csv?s=####&f=p”)
In the place of the hashes, you need to input the ticker that you looked up previously. So for example in the case of Kentz the formula should be
=importdata(“http://finance.yahoo.com/d/quotes.csv?s=KENZ.L&f=p”)
Alternatively, this command will get the price from Google, and can be linked to a cell rather than hard coding the ticker.
=googlefinance(B2,”price”)
If neither Yahoo or Google can provide the stock price you need then there are other ways to get stock prices. Any website can theoretically be called to get a price. The formula below for example will get the stock price from Bloomberg. This has the widest range of coverage that I have found.
=ImportXml(“https://www.bloomberg.com/quote/ORCL:US”,”//span[@class=’priceText__1853e8a5′]”)
Do this for each stock, putting the share prices in another column in the same row as the number of shares. If it doesn’t work, make sure you got the ticker from the same website (Yahoo/Google) as you are using in the formula.
Step 5: Get Exchange Rates
I, like many others, hold a lot of foreign stocks, and even some domestic holdings that have shares denominated in a foreign currency. We need to convert these holdings into our base currency in order to monitor performance. Luckily we can also extract these live from the web with a simple formula:
=googlefinance(“CURRENCY:USDGBP”)
USDGBP can be replaced with any currency pair you wish, and you can change the order (to for example GBPUSD) depending on what version of the exchange rate you want. All you need to know is the three letters that the Forex markets use to denote the currency. You can find this on Google, but some common ones are Canadian dollar (CAD), Australian dollar (AUD), US dollar (USD) and Pound Sterling (GBP).
Put these formulas somewhere in the spreadsheet so that you can refer to them. They should bring through a decimal number such as 1.554568
Step 6: Calculate Values
We now have everything we need to calculate the value of everything in the portfolio. Simply multiply the number of shares by the share price and then divide (or multiply depending on the rate used) by the exchange rate to get the value of that holding. I also like to work out each holding as a percentage of the portfolio total in another column.
Simply sum your holdings to get the overall value of the portfolio. You can compare this to earlier values and work out percentage gains/losses.
Step 7: Advanced Extras
There is other information you can retrieve from Yahoo finance, but it involves some trial an error. The command given above retrieves information directly from a dataset and the &f=p command at the end relates to the information being accessed (p = price).
You can experiment with this to get more information through on a stock, for example &f=x brings through where the stock is listed.
Using this guide you should be able to build a spreadsheet that tracks all the information you need, and you can then use things like charts to present the data however you prefer.


Awesome, didn’t know you do this in Google docs. Do you know where one can get prices for OEIC type funds?
In theory they should work the same as stocks. But it seems a bit random on which funds work or not. Most of the UK funds I have tried, that have Yahoo tickers that look something like GB0033228197.L don’t seem to work, but US funds like JPHAX do work.
I haven’t found a way around the problem if the Yahoo link doesn’t work.
I’ve finally figured it out.
Look up the fund on Google finance, it will have a code something like MUTF_GB:ABER_EMER_MARK_6TN5NU
The use the command
=googlefinance(B2,”price”)
Where B2 is just the cell with the fund code. That should work.
Are you able to get Japanese company quotes on Google spreadsheet? I can not get them through google finance or yahoo. Msn money has Japanese company quotes, but I do not know if one can pull in quote info from msn money into the google spreadsheet.
Thanks!
If the prices are saved in a .csv file somewhere on a website then you can bring them through with the same command as with the Yahoo .csv file.
The hard part is finding the direct link to the csv files underlying webpages.
Great post. You can also use the googlefinance() function to get historic stock data so you can track stock prices over a period, see e.g. http://www.mousewhisperer.co.uk/drivebunny/historical-stock-prices-in-google-sheets/
Thanks for the tips. I am getting Parse Error for the bloomberg code. Anyone can help. tks in advance!
Chris
Something strange is going on it seems, the code is correct, but copying and pasting the code into Google Docs doesn’t work.
After playing about I figured out if you delete the quotation marks ” and retype them manually then it works.
indeed it works! tks alot!
The Motley Fools provide a service that queries my banking and brokerage accounts. It refreshes on demand providing up to the minute reports on all of my accounts It reports current value of all of my accounts and what it is holding. Is there other software available that do this?
How do you update? Refresh isn’t working … thx!
Actually you can just import Yahoo data using a relative reference e.g.
=importdata(“http://finance.yahoo.com/d/quotes.csv?s=”&$A11&”&f=p”)
where the first column has the Yahoo symbol for the security you want.
f=n is handy to give you the name of the security
This works great for Canadian securities where Google Finance is not yet fully functional.
Helpful article but as you say Google and Yahoo don\’t cover all funds (about one quarter of those I own show 0.00 as the current price). And the code for the Bloomberg import appears not to work.
Can someone tell me should this link work.
=ImportXml(“http://www.bloomberg.com/quote/IBM:US”;”//span[@class=’ price’]”)
I cannot seem to get his to work.
Thanks.
I see you have to replace span with div, but still cannot get it to work.
=ImportXml(“http://www.bloomberg.com/quote/IBM:US”,”//div[@class=`Price`]”)
Sorry I haven’t got back to you in so long, but if anyone is still interested, some of the command is case sensitive. So here, Price should be price with a lower p. That should work.
Hi,
Thanks for that template i include dividends and purchasing price and some other details
Very simple you can find a template on my Blog.
http://www.financial—–freedom.blogspot.com
Cheers
L7
Great article! I’m curious, I can pull back the current stock price with this, what other data points are accessible? Is there a listing for these?
Glad it’s of some use besides being old. A lot of code appears to have broken but I’ve updated the spreadsheet with the formulae from my personal tracker so it at least works. I now use a combination of Google Finance and Bloomberg.
Google finance has lots of information to bring through besides price. It’s all listed here
https://support.google.com/docs/answer/3093281?hl=en
Bloomberg also has basically any information on their webpages but it’s harder to bring through and involves looking at the html and css code of the page.