Almost all investors assess their performance against ‘the market’. The premise is that if you are spending time actively managing funds then to make it worthwhile you should at least beat a simple tracker fund which would take no effort whatsoever.
But just how easy is it to beat the market? Looking at the performance of most mutual fund managers you could be forgiven for thinking that it isn’t easy at all! The fact is a lot of managers fail to beat the market, while the ones that do, like Warren Buffett, are catapulted to stardom as heroes of the industry.
An interview I watched recently with Joel Greenblatt got me thinking. In the interview Joel states that if you have a fund with an equal weighting in each of the S&P 500 companies, it would have beaten a tracker fund over the last 5 and 10 years, which weights holdings based on market cap.
To understand how this works, take for example a market with two companies, A and B, with market caps of $30bn and $70bn respectively. Under a usual tracker fund, $100 invested would be split $30 in A and $70 in B, whereas an equally weighted fund would put $50 in A and $50 in B.
Weighting of the portfolio
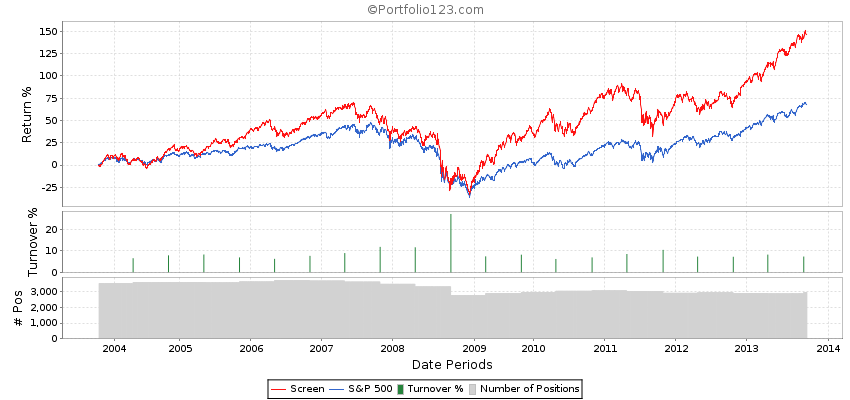
Now I don’t know about you, but I don’t weight my holdings by market cap, so surely if what Greenblatt says is true, that immediately puts me at an advantage to the market? I decided to test the theory, and did a back-test of the investment returns that could be achieved by simply investing in companies with over a $5bn market cap, with equal weighting, re-balancing every 6 months. The results are below.
Over 10 years it gave an annualized return of 9.8% versus 5.3% for the S&P 500. Greenblatt was right.
This result really puts the under-performance of fund managers into perspective. Arguably they should be beating not just the S&P 500, but this equally weighted version too! It requires minimal oversight and insight, but clearly fund managers can’t manage this.
To understand why equal weighting beats market cap weighting, we need to think about the intrinsic value of companies as opposed to their market values. A tracker fund puts more weight on overvalued companies and less weight on undervalued companies by its very nature, and when securities are overvalued then investors should expect lower returns over the long term.
So the results of this back test shouldn’t be a surprise to many value investors, who know that the market frequently mis-prices shares.
Small cap vs. Large cap
Moving away from fund managers now, to individual investors; the last screen looked at companies with a market cap over $5bn in order to be similar to the S&P 500. But individual investors have position sizes small enough to invest in smaller companies. I have often seen research which says smaller companies give better returns and show back-tests compared to the S&P 500. The argument is these companies have greater potential for growth, so should in theory provide better returns. I performed the same back-test as before but this time restricting the market cap from $100m to $5bn.
This beats the S&P 500, with annualized returns of 9.5% versus 5.3%, but over the first 5 years the results were less convincing. But when we compare performance to the previous chart, it is actually similar, if not worse than the larger companies, suggesting that actually, smaller companies don’t have such a clear advantage after all.
It appears that the truth behind this myth is that the equal weighting is actually driving the gains versus the S&P 500, rather than the size of the companies.
A realistic portfolio
Finally, for the benefit of the individual investor I want to look at a more realistic portfolio. The last two scenarios have hundreds, if not thousands of holdings which isn’t possible even for a lot of fund managers, let alone an individual investor. By adding some additional filters to the test we can simulate a much more realistic portfolio to see what kind of returns we as individual investors should be getting.
The final back-test is based on the following criteria
- Price/Earnings ratio less than 20 – as we don’t want to pay too much for a business
- Return on Investment greater than 15% – as we want strong companies with competitive advantages
- Interest coverage greater than 10 – as we want financially stable companies and no possible debt problems
- No Over-The-Counter stocks
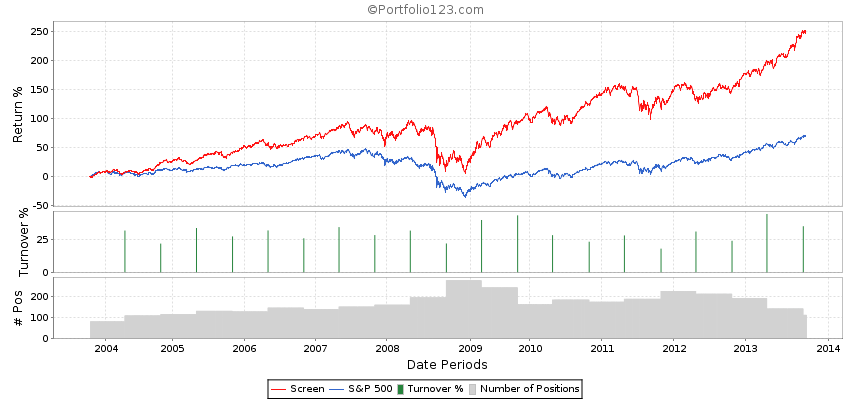
The results are below.
This back-test trounces the S&P 500 with an annualized return of 13.2% versus 5.3%. It also has a beta of 0.71 which means it is less volatile than the market at the same time as delivering out-sized returns. When a simple screen like this beats the market so convincingly, surely we as investors should all be doing the same? If not then arguably we should be switching to a simple mechanical strategy like this and saving ourselves a lot of time and effort in the process.
Conclusion
You may think I have cherry-picked some screens in order to prove my point, but I can honestly say that any other screens I ran came out with the same results and that I chose the criteria before running the back-tests in order to be objective. The evidence is convincing that individual investors have an inherent advantage over the market because they do not have to weight by market cap, which puts more weight on overvalued companies and less weight on undervalued companies by its very nature.
It also highlights the under-performance of many fund managers as they too possess this inherent advantage over the market yet clearly fail to exploit it.
If you are failing to achieve results that are outperforming these three screens, or are investing in mutual funds that aren’t, then perhaps it is time to rethink your strategy and investment allocations.


Hi Andy! Really interesting post!
I have one question regarding the holding period of the screened stocks you included in that last portfolio. Do you keep ’em till they stop fulfilling your established criteria or do you keep them for the long run?
Again, thank you for sharing!