

I like to think of myself as open-minded, I try to not to let my pre-existing biases get in the way of learning new things and new ideas. But I also like to think of myself as a skeptic – unless someone can show evidence or proof that an idea is correct, I’ll have a hard time accepting it.
So when it comes to Technical Analysis [definition here] you can see why I am of two conflicting minds. Like most value investors, I have a tendency to dismiss TA and just focus on valuation, but after attending some friendly get togethers with other investors in London I discovered there are people out there that have been using TA to make money for decades – maybe there is something to this TA after all?
Know your enemy
Over time I have been using some TA in my investment philosophy, but there is another reason its useful to understand a bit of TA beyond making money. Most people in the market that use TA will just be using basic strategies and their behavior is quite predictable when you know the strategies they use. You can predict where most people’s stop losses are or when they will exit profitable positions. The practitioners of TA that I know use analysis far beyond these basics, and most mainstream ‘Technical Analysts’, in order to make money. As with most things, you don’t make money by following the herd.
The Basics
I stick to the basics in applying TA to my value investing philosophy, which boils down to Resistance and Support. Investopedia defines these as:
Resistance: “A chart point or range that caps an increase in the level of a stock or index over a period of time. An area of resistance or resistance level indicates that the stock or index is finding it difficult to break through it, and may head lower in the near term. The more times that the stock or index has tried unsuccessfully to break through the resistance level, the more formidable that area of resistance becomes.”
Support:”The price level which, historically, a stock has had difficulty falling below. It is thought of as the level at which a lot of buyers tend to enter the stock. “
As with most things, a picture speaks more than a thousand words.
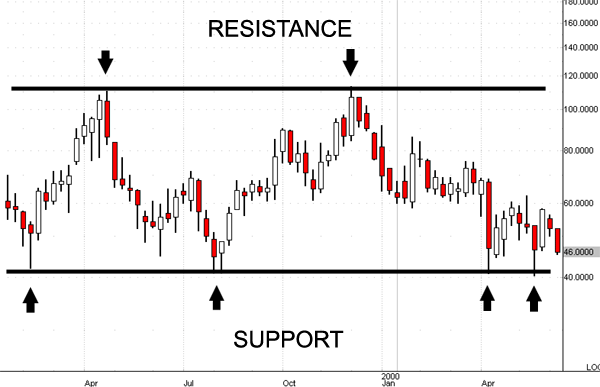
Most investors will see these levels and put stop losses/limit orders quite close to them. This creates the effect that once the share price breaks out of this range, it keeps on going. In the case of stop losses they will be placed just below the support and so once the price drops below, there are a large number of sell orders that get triggered. This selling forces the share price down further. On the upside, people will place limit orders just below a resistance level. This creates selling pressure once the price approaches that level, but once it goes beyond the resistance level, there are suddenly no sell orders to hold it back. Also many TA’s will see the breakout and buy shares hoping to ride it. This creates even more pressure on the share price upwards.
That is the theory anyway – in reality breakouts can, and do, fail, and when they do it is usually in spectacular fashion as traders rush for the exits.
Examples
That is how other people use support and resistance, now I will go over how I have used it along side a value investing philosophy. Rather than explain it in words, it’s easier to just go through a couple of examples.
Example 1: One of my early investments was in Deckers Outdoor ($DECK), which I bought on 16th April 2012. This is an example of where I didn’t do the right thing. Here was the chart on the date I bought.

You can see there was a support level at just above $70 which was broken through just a few weeks before. This is what Technical Analysts would call a ‘breakout’ and it is fairly unpredictable what will happen next, there is a good chance it will go a lot lower for the reasons I gave previously. It is also showing one of the few patterns I know of in TA, a ‘head and shoulders‘. This has nothing to do with shampoo, but is simply a pattern that predicts a high probability the share price will fall in the short term.
But I was a pure blooded value investor at the time and I liked DECK at this price so I immediately entered a full size position. This is what happened in the next 6 months.

It’s quite obvious this is in a down trend. I was down a good 30-40% on my position at this point and so I did what any value investor would do, I increased my holding. But because I had already made this a ‘full’ position size that I was comfortable with, I could only increase the holding by around 25% – so couldn’t take full advantage of the price fall.
Unknown to me at the time, this was actually a good time to buy from a TA perspective. If you connect the peaks on the downward trend you get a resistance level (they don’t have to be horizontal) and the move upwards in the days before had broken through this level and was now a ‘breakout’ to the upside. The price kept increasing and I exited the position in the next few months.
So where did I go wrong here? Was I wrong to buy when I did? Well I would say no, as a buy decision should always be based on valuation and not charts in my opinion. But the charts where showing that it had a good chance of going lower in the short term, so what I shouldn’t have done is make this a full position size from the outset. By doing this I was betting against some pretty strong technical signals. If I had made it half size then I could have taken advantage of cheaper buy prices if it fell, and secured a quick profit if it rose – win win.
Example 2: Here is an example where I did use TA to influence my position size. My biggest position is Craven House Capital ($CRV.L) and when I first analyzed the company I thought it was worth multiples of its share price and wanted to make this a large holding. But after what happened with DECK (and many other holdings like it) I was nervous to make it a big position from the start in case it fell more in the short term. That is until I saw the chart.
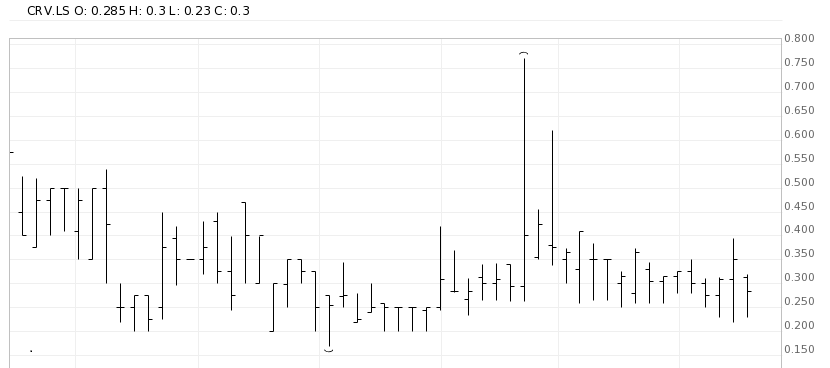
You can see the strong support at the 0.20 level, and then at the 0.25 level in the shorter term, having failed multiple times to drop below this level. I immediately put 20% of my portfolio into the stock and it turned out to be a wise decision.

The stock gave a brief opportunity over the next couple of months to buy at the 0.25-0.30 level and suddenly rocketed to a new level and has never dropped back since.
Conclusion
What I have gone through here is TA at its most basic level as I personally use it. I am no expert and it goes far beyond this but for me I see no benefit learning complex mathematical methods when the basics do all I need from them.
I am not a proponent of technical analysis – I would never use it to influence whether to buy a stock or not and instead would always rely on fundamental valuation. But I hope that I have provided some food for thought – that at times it can be beneficial to think about TA on even the most basic terms when deciding how big to make positions. It will not work all of the time, I have chosen a couple of examples here that happen to demonstrate TA well. While I didn’t have to cherry pick from my holdings, I am sure there are some where TA would have failed.
Investing Sidekick
Founder of Investing Sidekick. Works as a research analyst and is an avid value investor, always searching for undervalued shares.
You need to watch out for so many things before you buy a stock, and adding TA to the list is just not worth it IMO.
Pabrai uses a checklist and I doubt “look at the chart” is one of those things on his checklist.